Why can electricity use fall during a blackout?
A lower reading can mean less electricity was delivered—not that people needed less. That distinction changes what you can conclude about a grid.
GERT · Dresden Goehner · September 13, 2026 · Historical educational example
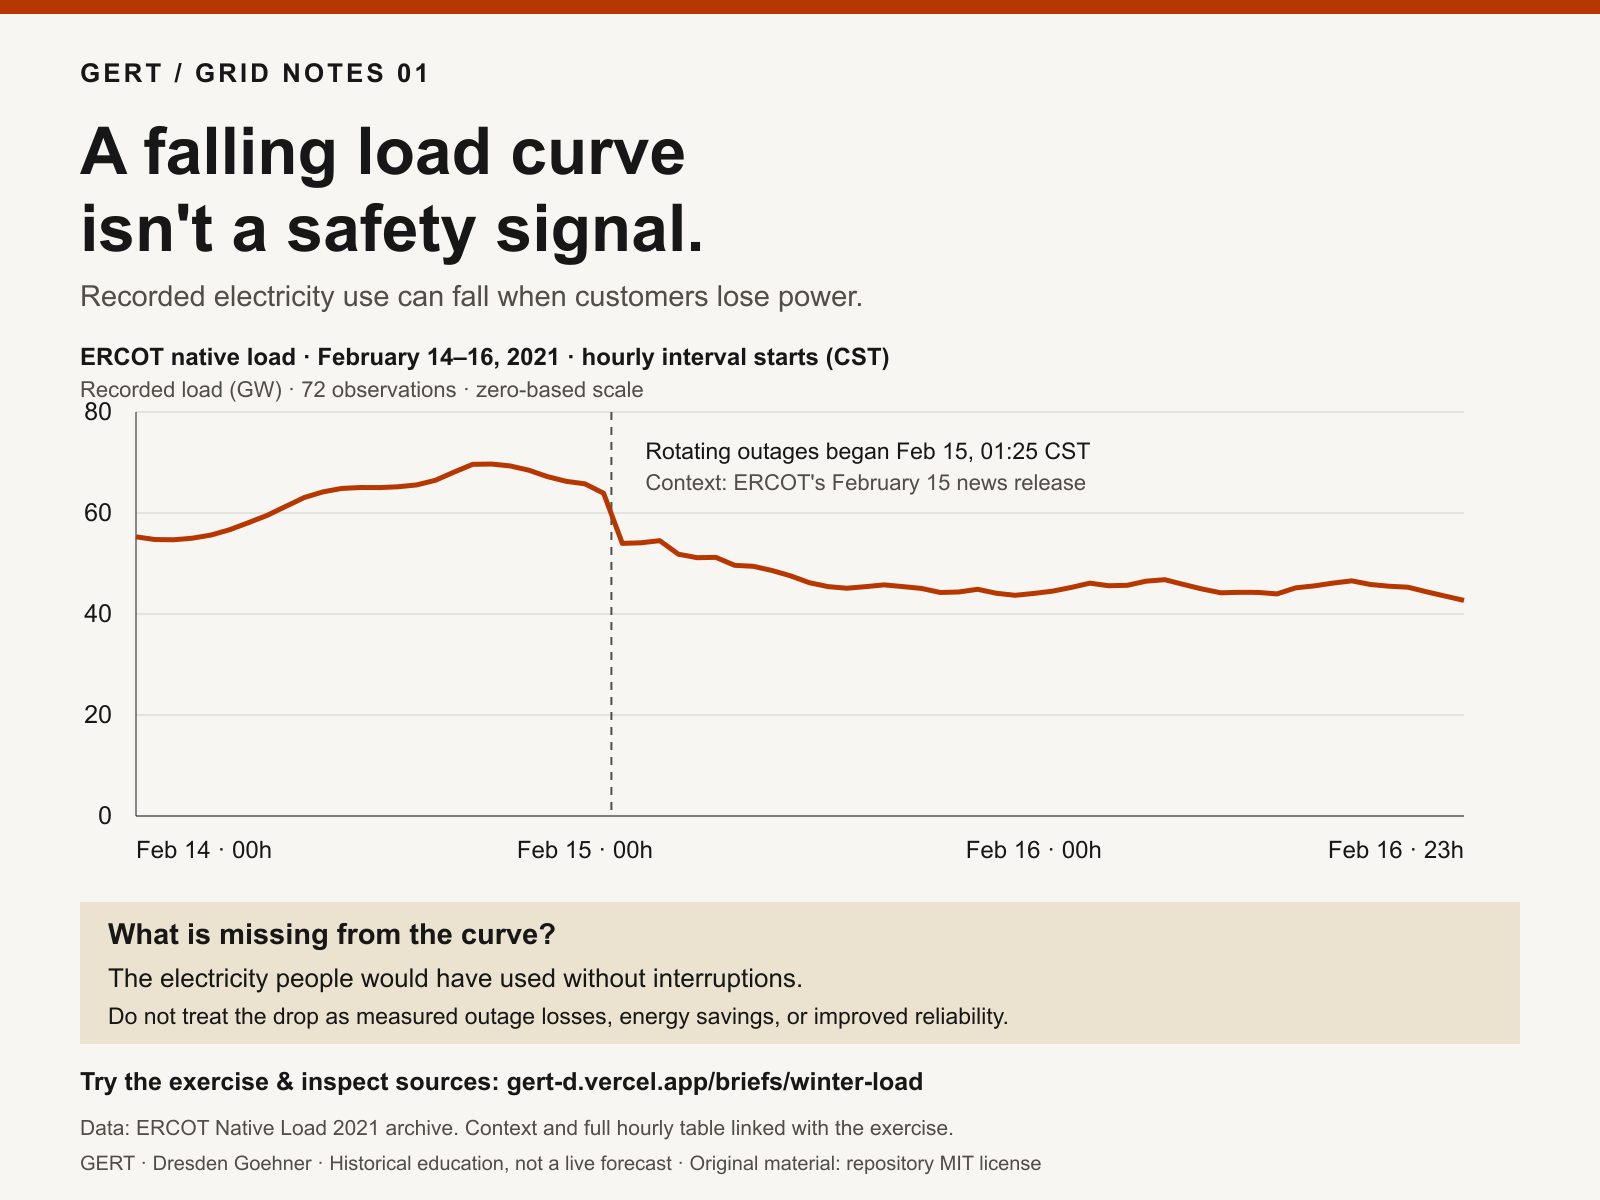
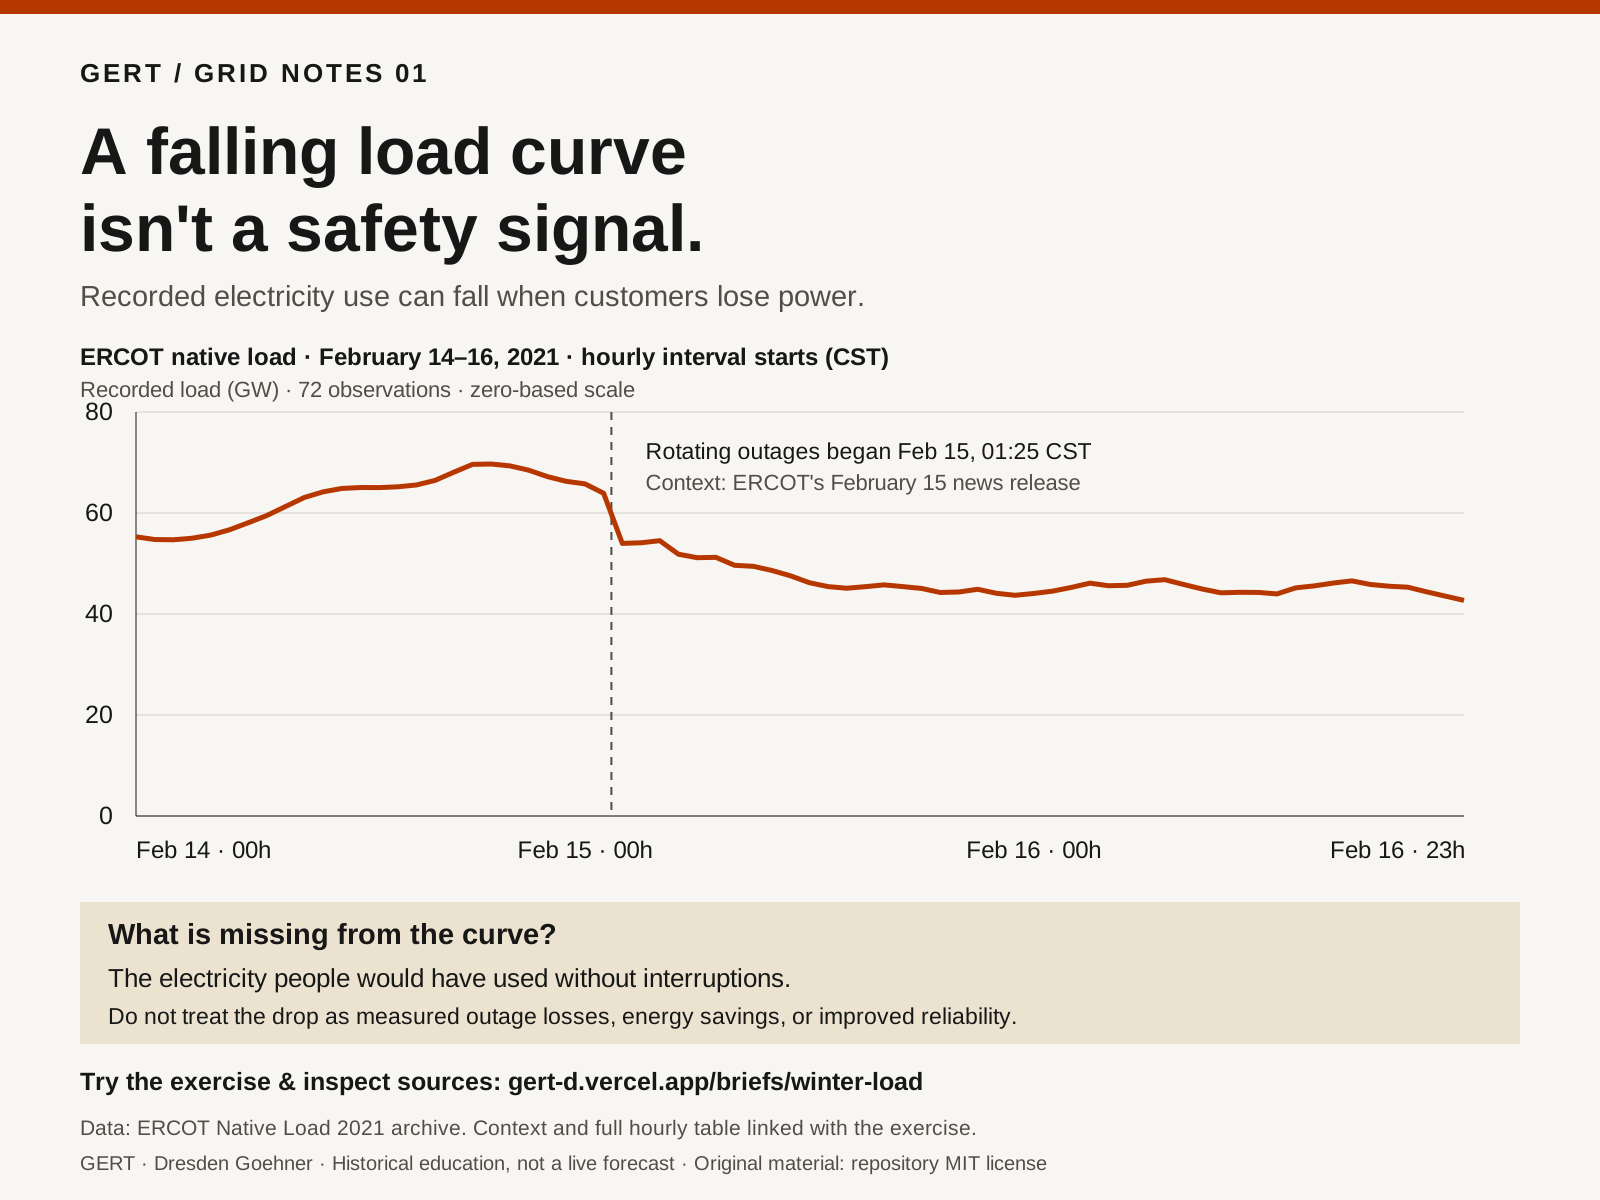
A measurement is not the whole system.
ERCOT reported that rotating outages began at 01:25 a.m. on February 15, 2021, after generating units became unavailable. When customers are disconnected, some intended electricity use cannot appear in the recorded load. Read the contemporaneous report.
What this curve cannot establish
- Demand in the absence of interruptions.
- The amount of electricity not supplied.
- Whether reliability improved, or an intervention worked.
We do not attribute every change to outages. Weather, behavior, and other system conditions also matter.
Same meter. Two worlds.
Build two invented situations with identical electricity readings but different unmet demand. Change an assumption and inspect the arithmetic yourself.
Try the interactive explanation →Two questions. No sign-up.
Choose your answers, then reveal the explanation. Your first answers stay in the downloadable record. Nothing is sent to GERT.
Now change an assumption.
Open the winter case with an explicitly assumed 60,000 MW capacity and no load reduction. The arithmetic gap is a counterfactual exercise—not historical outage losses. Try other assumptions and export the calculation.
Explore the winter case →Leave a substantive reviewSources, exact values, and reuse
- ERCOT Native Load 2021 archive — the source of the 72 hourly observations. Interval starts, America/Chicago (CST here); MW in the data, GW on the chart.
- ERCOT news release, February 15, 2021 — the source of the rotating-outage start time. The release is contemporaneous, not a complete retrospective loss estimate.
- Exact plotted data and metadata · Figure generator · ERCOT data-use terms, section 5.
GERT is independent of ERCOT. No affiliation or endorsement is implied. The original graphic and explanation follow the repository MIT license; underlying data remains attributed to its source. Read the complete notice in the forwarding pack.
Inspect all 72 hourly source values
| Interval start | Recorded load (MW) |
|---|---|
| 2021-02-14T00:00:00-06:00 | 55282.612 |
| 2021-02-14T01:00:00-06:00 | 54746.708 |
| 2021-02-14T02:00:00-06:00 | 54701.390 |
| 2021-02-14T03:00:00-06:00 | 55005.102 |
| 2021-02-14T04:00:00-06:00 | 55630.169 |
| 2021-02-14T05:00:00-06:00 | 56680.454 |
| 2021-02-14T06:00:00-06:00 | 58071.474 |
| 2021-02-14T07:00:00-06:00 | 59511.077 |
| 2021-02-14T08:00:00-06:00 | 61299.993 |
| 2021-02-14T09:00:00-06:00 | 63072.424 |
| 2021-02-14T10:00:00-06:00 | 64185.234 |
| 2021-02-14T11:00:00-06:00 | 64864.156 |
| 2021-02-14T12:00:00-06:00 | 65047.452 |
| 2021-02-14T13:00:00-06:00 | 65028.901 |
| 2021-02-14T14:00:00-06:00 | 65188.549 |
| 2021-02-14T15:00:00-06:00 | 65556.735 |
| 2021-02-14T16:00:00-06:00 | 66468.018 |
| 2021-02-14T17:00:00-06:00 | 68094.825 |
| 2021-02-14T18:00:00-06:00 | 69635.087 |
| 2021-02-14T19:00:00-06:00 | 69692.485 |
| 2021-02-14T20:00:00-06:00 | 69324.247 |
| 2021-02-14T21:00:00-06:00 | 68473.934 |
| 2021-02-14T22:00:00-06:00 | 67200.980 |
| 2021-02-14T23:00:00-06:00 | 66270.516 |
| 2021-02-15T00:00:00-06:00 | 65777.077 |
| 2021-02-15T01:00:00-06:00 | 63910.401 |
| 2021-02-15T02:00:00-06:00 | 53982.966 |
| 2021-02-15T03:00:00-06:00 | 54102.714 |
| 2021-02-15T04:00:00-06:00 | 54522.956 |
| 2021-02-15T05:00:00-06:00 | 51839.580 |
| 2021-02-15T06:00:00-06:00 | 51147.726 |
| 2021-02-15T07:00:00-06:00 | 51220.191 |
| 2021-02-15T08:00:00-06:00 | 49646.299 |
| 2021-02-15T09:00:00-06:00 | 49443.179 |
| 2021-02-15T10:00:00-06:00 | 48615.527 |
| 2021-02-15T11:00:00-06:00 | 47548.021 |
| 2021-02-15T12:00:00-06:00 | 46197.976 |
| 2021-02-15T13:00:00-06:00 | 45423.548 |
| 2021-02-15T14:00:00-06:00 | 45100.613 |
| 2021-02-15T15:00:00-06:00 | 45416.829 |
| 2021-02-15T16:00:00-06:00 | 45767.296 |
| 2021-02-15T17:00:00-06:00 | 45425.706 |
| 2021-02-15T18:00:00-06:00 | 45061.707 |
| 2021-02-15T19:00:00-06:00 | 44257.287 |
| 2021-02-15T20:00:00-06:00 | 44364.439 |
| 2021-02-15T21:00:00-06:00 | 44894.441 |
| 2021-02-15T22:00:00-06:00 | 44100.045 |
| 2021-02-15T23:00:00-06:00 | 43704.295 |
| 2021-02-16T00:00:00-06:00 | 44070.049 |
| 2021-02-16T01:00:00-06:00 | 44524.149 |
| 2021-02-16T02:00:00-06:00 | 45258.654 |
| 2021-02-16T03:00:00-06:00 | 46108.298 |
| 2021-02-16T04:00:00-06:00 | 45598.004 |
| 2021-02-16T05:00:00-06:00 | 45681.929 |
| 2021-02-16T06:00:00-06:00 | 46501.875 |
| 2021-02-16T07:00:00-06:00 | 46796.658 |
| 2021-02-16T08:00:00-06:00 | 45855.511 |
| 2021-02-16T09:00:00-06:00 | 44947.878 |
| 2021-02-16T10:00:00-06:00 | 44196.114 |
| 2021-02-16T11:00:00-06:00 | 44291.851 |
| 2021-02-16T12:00:00-06:00 | 44273.062 |
| 2021-02-16T13:00:00-06:00 | 43977.836 |
| 2021-02-16T14:00:00-06:00 | 45176.698 |
| 2021-02-16T15:00:00-06:00 | 45569.701 |
| 2021-02-16T16:00:00-06:00 | 46123.615 |
| 2021-02-16T17:00:00-06:00 | 46562.497 |
| 2021-02-16T18:00:00-06:00 | 45843.067 |
| 2021-02-16T19:00:00-06:00 | 45498.773 |
| 2021-02-16T20:00:00-06:00 | 45306.602 |
| 2021-02-16T21:00:00-06:00 | 44392.860 |
| 2021-02-16T22:00:00-06:00 | 43538.402 |
| 2021-02-16T23:00:00-06:00 | 42691.437 |